Analysis of candlestick elements for forecasting in the Forex market and other financial markets
For online transactions on financial markets, the NordFX brokerage company offers its clients the world's most popular trading terminal - MetaTrader 4 (MT4). After downloading it, the trader will see three possible options for the graphical display of quotes for trading instruments in the "Properties" section - these are bars, a line and Japanese candlesticks.
Agree that candlesticks, and even Japanese ones, are difficult to recognize as a tool of technical analysis. But this is only at first glance.
History of candlestick charts
To begin with, some facts from history, which began back in the 18th century, when Japanese traders started to use this method for market predictions of rice prices. It was invented by a merchant named Munehisa Homma, who began to study the entire history of the rice trade in Osaka. In doing so, he took into account not only the price change itself, but also its reasons, including the psychological aspects of trading. Munehisa Homma was so successful that he eventually became a samurai and even became a financial advisor to the government, applying his methods of Japanese candlestick analysis to other market products. He authored three books - "The Three Monkey Record of Money", "The Candlestick Trading Bible" and "Candlesticks Made Easy".
As a trader, Munehisa Homma was distinguished by an integrated approach to the study of the economic situation. He understood that success is largely determined by the speed of obtaining important information and developed a whole system of emergency news transmission for this purpose. On every kilometer, people were stationed who transmitted the news using light signals, which allowed Munehisa Homma to be far ahead of his competitors and make more than 100 profitable trades in a row.
After 250 years, a trader can receive the most important financial information online using the news feed, which, along with the Japanese candlestick chart, is one of the options of the MT4 terminal. And although hardly anyone can guarantee you 100 profitable trades in a row and the title of a samurai in the bargain, both of these options can be of invaluable help, signaling to open a trade in the right direction at the right time.
Note that candlestick chart analysis has come to the world of modern Western trading only recently. Back in the mid-80s of the last century, there were only three main ways of reflecting the chart of an asset, including in Forex, - "point and figure", bars and a line. (The latter two are also part of the MetaTrader 4 arsenal). The analysis of candlestick patterns among traders gained popularity after the publication in 1991 of the book Japanese Candles. Graphical Analysis of Financial Markets. This publication made a real boom, and its author Steve Nison became so popular that he even opened his own consulting firm, Nison Research International.
Following the first, Nison published his second work, Beyond Candlesticks. These two books are the most popular, but they include only a few of the patterns that emerge from candlestick technical analysis.
One can also note the book by Gregory L. Morris Candlestick Charting Explained: Timeless Techniques for Trading Stocks and Futures, although some experts and practitioners had a number of complaints about it. It also makes sense to pay attention to Thomas Bulkowski's work “Encyclopedia of Candlestick Charts” and to Vladimir Gusev's works “Japanese Candles. Collection of Models” and “Japanese Candles. Features of Application”. All of them are devoted to the intricacies of using this type of graphical analysis, and are also adapted for the forex market.
Types of Japanese Candlesticks: Bulls, Bears and Doji
Japanese candlesticks have received huge sympathy among traders due to their high information content compared to line charts. A candlestick consists of the following elements: body and shadows (one or two). The body of the candlestick is the distance from the open price to the close price in the selected time interval (on MT4, this is M1, M5, M15, M30, H1, H4, D1, W1, or MN). The upper shadow denotes the maximum that the price approached during this time, the lower one - the minimum.
There are two main types of candlesticks, namely “bullish” and “bearish” (Fig. 1).
The former are formed as a result of activation of buyers (in the slang of traders "bulls"), they always have the closing price above the opening price (Fig. 1a). In the classical literature, which we have listed above, they are denoted in white. However, in modern trading platforms, such as MetaTrader 4, a trader can paint a candle on their own, and often green bullish candles are used.
“Bearish” candles are formed under the pressure of sellers (“bears”), so their closing price is always lower than the opening price (Fig. 1b). In textbooks, they are indicated in black. If we are talking about the MT4 terminal, preference is given to red.
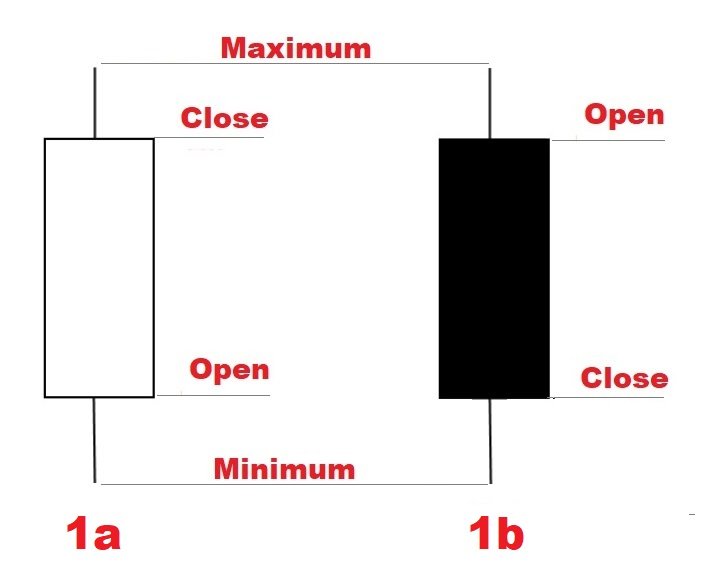
All candlestick elements play a vital role in informing the trader. The length of the shadow, the size of the candlestick's body can tell us which moods prevail at the moment in the market, who, “bulls” or “bears”, have more strength, and who have almost run out.
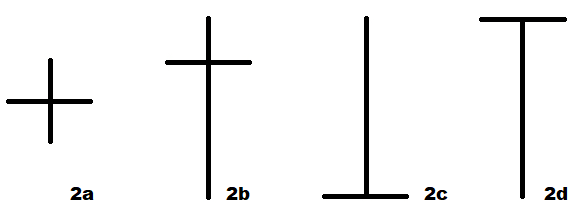
Separately, we would like to draw your attention to the fact that you can find Japanese candlesticks on the chart, in which the opening price is equal to the closing price. They usually appear during a period of decreasing liquidity or uncertainty (inactive trading session, holidays, weekends, absence of a major player, waiting for the release of important macroeconomic data). Such candlesticks are commonly called “Doji”. And since the body of the Doji is practically absent, they cannot be attributed to either “bullish” or “bearish” candlesticks. Fig. 2 shows their main types: 2a - "Star", 2b - "Long-legged Doji", 2c - "Tombstone" and 2d - "Dragonfly".
How to analyze Japanese candlesticks?
Candlesticks are the most important source of information that allows you to see the upcoming developments in advance. The fact is that their combinations and special forms form patterns that are repeated many times from year to year. The analysis of Japanese candlesticks in trading is based on finding these patterns and their correct interpretation. That is why the study of the candlestick chart and the search for all patterns occurs only on a closed, fully formed candlestick. This is a basic rule, violation of which can lead to unpleasant consequences. A price change within the working interval (time frame) can redraw the contours of the candle several times. Therefore, until the candlestick closure has taken place, the signal that appears cannot be perceived as a command for action.
Varieties of candlestick patterns
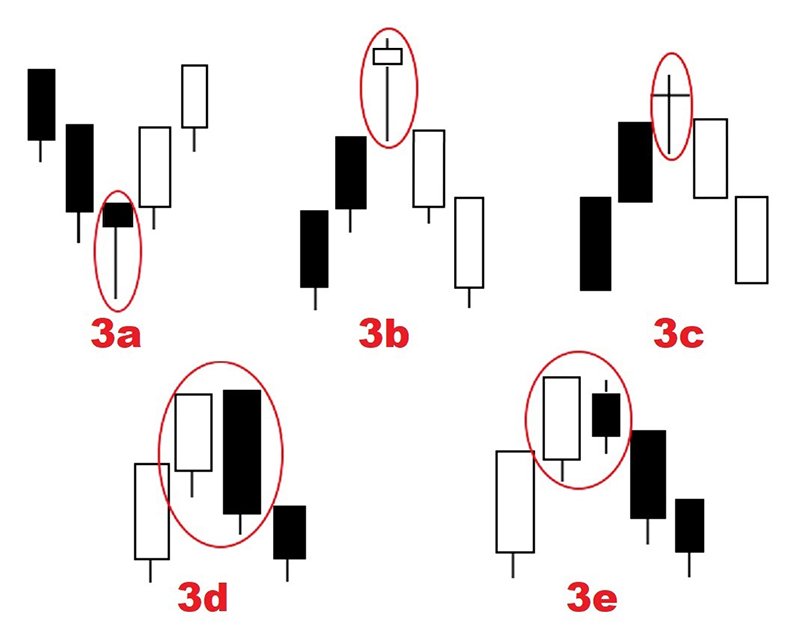
Globally, all candlestick patterns are usually divided into simple and complex ones. Simple ones are patterns that consist of one or two Japanese candlesticks (Figure 3). These are the ones we can most often find when studying asset charts. For example, the following can be attributed to simple patterns: 3a - "Hammer", 3b - "Hanged Man", 3c - "Doji", 3d - "Absorption", 3e - "Harami" (translated from Japanese - pregnant).
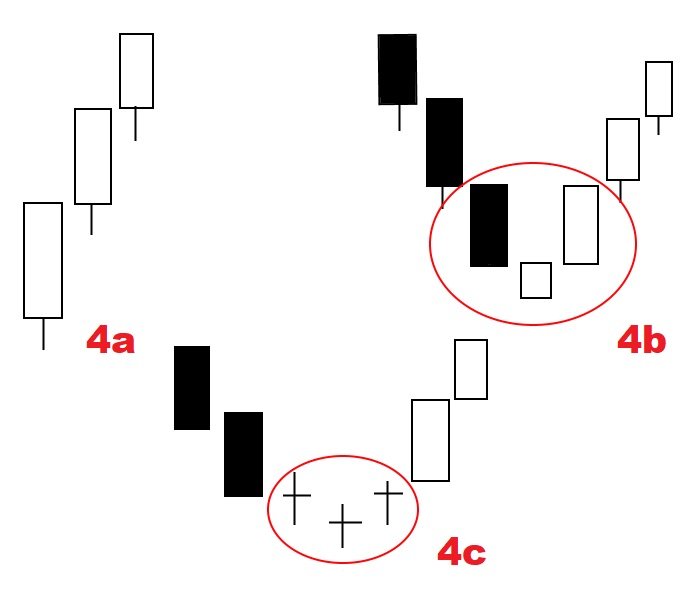
Complex combinations (patterns) consist of three or more candles, but they are much less common in practice (Fig. 4). Interestingly, multiple studies indicate that the complexity of the combination does not necessarily have a positive effect on the performance of the analysis. Simply put, an increase in the number of candlesticks involved in a pattern does not guarantee an increase in forecast accuracy.
The figure shows some variants of complex combinations: 4a - "Three White Soldiers", 4b - "Morning Star", 4c - "Three Doji Stars".
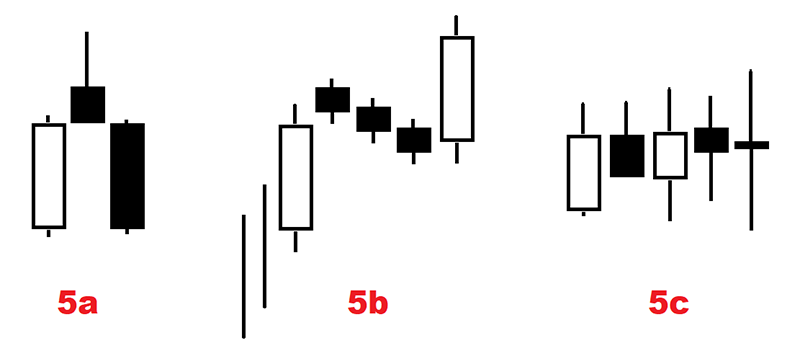
There are dozens and even hundreds of candlestick patterns. And it is impossible to talk about all of them within the framework of one article, therefore we strongly advise you to familiarize yourself with the textbooks described above. We only note that, from the point of view of the forecast, depending on where the market will go after a certain pattern appears, candlestick combinations are usually divided into: reversal (for example, 5a - “Shooting Star”), trend continuation (5b - “Holding on tatami "within the upward trend) and uncertainty (5c).
But, again, these are just some combinations of many. Moreover, the effectiveness of using a particular pattern will also depend on the conditions under which you defined it. And this is the time of the trading session, the time frame used, the traded currency pair or other financial instrument, as well as many other factors. There are more than 30 currency pairs on the platform of the brokerage company NordFX, as well as cryptocurrencies, about 70 shares of leading companies, and stock indices ... And each such financial instrument needs its own approach.
The ability to read the candlestick chart, candlestick bodies, the size of the shadows, the combinations that appear, can tell a lot, help to understand the mood of the trading participants. Nevertheless, you will achieve the best effect by combining patterns with other technical analysis tools - trend indicators and oscillators. This will allow you to create an effective trading strategy with which you can consistently earn not only in the Forex market, but also in many other financial markets.
Go Back Go Back
