Last updated: June 2026
Technical indicators help bring structure to fast-moving gold charts by highlighting momentum shifts, volatility conditions and potential price inefficiencies. In our broader Gold Trading Guide: How to Trade XAUUSD Step by Step, indicators play a supporting role: they refine entries, help manage risk, and add clarity to a trader’s plan.
Below is a practical, trader-focused walkthrough of how to apply Stochastic, ATR, Fair Value Gaps (FVG), and several other tools to XAUUSD.
For more context on the pair itself, you may also find value in What Is XAUUSD? Gold vs USD Explained for Forex Traders and insights into market conditions in Best Time to Trade Gold (XAUUSD): Sessions, Volatility and News.
A quick answer:
Technical indicators on gold charts work best as confirmation tools rather than standalone signals. Stochastic highlights momentum reversals, ATR measures volatility for stops and position sizing, and FVG outlines potential return-to-value zones. Used together, they help create more structured XAUUSD trading decisions.
Key points
• Stochastic identifies overbought/oversold momentum swings in gold’s short-term moves.
• ATR is central for volatility-based stops, targets and dynamic position sizing.
• FVG zones show potential imbalances where price may later revisit.
• Indicators should complement structure, trend and news, not replace them.
• Combining tools reduces false signals and helps with risk management.
Understanding the Role of Indicators in XAUUSD Trading
Indicators simplify complex price movement by quantifying momentum and volatility. Gold’s behaviour can shift rapidly during major news events, liquidity pockets or sudden risk-on/risk-off changes. Indicators provide consistency: they apply the same mathematical rules regardless of market mood.
Yet indicators remain secondary tools. The primary context for gold is still trend, market structure, price levels and fundamentals. If you need more on those drivers, see Fundamental Drivers and Economic News that Move Gold (XAUUSD).
Indicators should answer two questions:
- Is this a good place to enter based on momentum or volatility?
- Can I manage risk meaningfully under current market conditions?
The Stochastic Oscillator on Gold Charts
The Stochastic helps detect momentum exhaustion. On XAUUSD, where price often makes sharp, extended swings, Stochastic can highlight when momentum is losing strength, potentially signalling pullbacks or reversals.
How the Stochastic Works on Gold
Stochastic compares current price to its recent range. Readings above 80 often indicate stretched momentum, while readings below 20 show potential exhaustion on the downside. This does not mean gold must reverse immediately, but it helps locate areas where continuation becomes less likely.
Practical Trade Applications
- Pullback entries in a trend:
- In an uptrend, traders often look for Stochastic dips below 20 and then a cross back upward. This may align with a price pullback into support.
- Momentum fade at resistance:
- If gold approaches a strong daily resistance with Stochastic above 80 and crossing down, traders may anticipate a slowdown or retracement.
- Filtering breakout trades:
- Before entering a breakout, Stochastic can help confirm momentum is aligned rather than already exhausted.
Example
Suppose gold is trending up from 2250. Price pulls back to 2235, a previous structure level. Stochastic dips below 20 and turns upward while price prints a bullish candle. A trader may see this as momentum returning and place a limit order or stop entry above the candle high, managing risk below 2230.
Average True Range (ATR) for Gold’s Volatility
ATR measures volatility, not direction. Gold’s volatility is typically higher than many currency pairs, so using ATR helps avoid stops that are too tight or take-profit levels that are unrealistic.
How ATR Improves Risk Management
- Stop-loss placement:
- Traders often place stops 1–2 ATR below a swing low in an uptrend or above a swing high in a downtrend. This accommodates natural XAUUSD noise.
- Position sizing:
- Higher ATR means lower position size to maintain stable risk. Lower ATR conditions may allow larger size. This links directly to Risk Management for Trading Gold: Position Sizing and Volatility Control.
- Target projection:
- ATR-based targets help define whether a trade has enough room to move. If ATR is low, expecting a large move may be unrealistic.
Example
If ATR(14) on the H1 chart is 4 dollars, a trader placing a buy at 2250 might use a 6–8 dollar stop (1.5–2 ATR). A reward target could be 8–12 dollars depending on structure, producing a clear R-multiple before entry.
Fair Value Gaps (FVG): A Structural Indicator for Price Imbalance
Fair Value Gaps highlight zones where price moved too quickly, leaving insufficient two-way trading. Many traders monitor these areas because price may later revisit or fill the imbalance.
Identifying FVGs
An FVG is typically drawn when a three-candle sequence shows that the middle candle’s body or wick failed to overlap with the previous or next candle. On gold, these happen frequently during news or during high-liquidity sessions like London or New York.
How Traders Use FVGs
• Return-to-value pullbacks:
In a strong trend, a pullback into an FVG can offer a structured entry aligned with direction.
• Reversal zones:
If an FVG sits near a higher timeframe level, price filling it may coincide with momentum changes.
• Confluence with Stochastic:
When Stochastic shows exhaustion and price touches an FVG zone, the combination can strengthen the case for a reaction.
Example
Gold rallies from 2230 to 2250 in one impulse, leaving an FVG between 2242 and 2245. Price later retraces. A trader watches for bullish evidence as it enters the FVG. If momentum turns up and ATR supports reasonable stops, this area might offer an asymmetric entry.
Combining Indicators: A Practical Framework for Gold Charts
Indicators should complement each other. A common mistake is stacking many indicators that all measure the same thing. A better approach is to use a small, diverse set: momentum, volatility and structure.
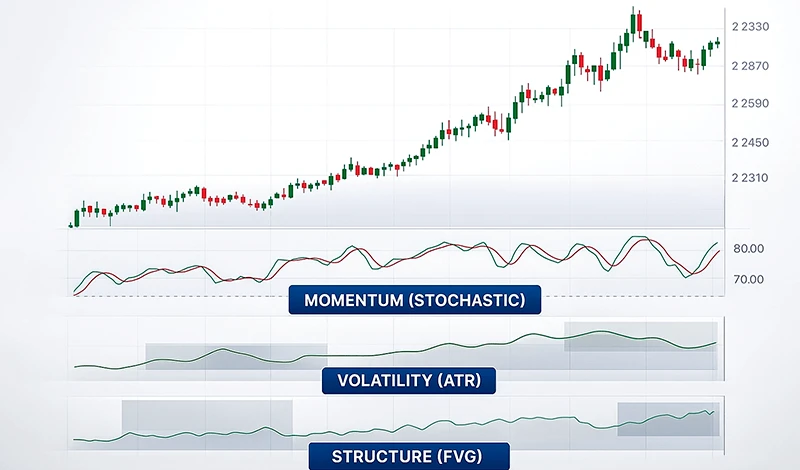
A Three-Indicator Model
- Momentum: Stochastic
- Volatility: ATR
- Structure: FVG or support/resistance
This covers the core components of a trade: direction, timing, and risk.
Example Workflow
• Identify trend on H4 or H1.
• Mark structure levels and any visible FVGs.
• On entry timeframe (M15–M30), check if Stochastic aligns with expected direction.
• Use ATR to size the stop logically.
• Confirm risk-to-reward before placing the trade.
This produces systematic decision-making that aligns well with concepts covered in Gold Trading Strategies: Day Trading, Swing and Trend Following on XAUUSD.
Additional Useful Indicators for XAUUSD
Indicators below are not mandatory but often appear in active gold traders’ toolkits.
Moving Averages
Simple and exponential moving averages help define trend direction and dynamic support/resistance. On gold, 20- and 50-period MAs on H1 or H4 are common. Crossovers are less reliable than using MAs as trend filters.
RSI
RSI acts similarly to Stochastic but smooths momentum. Divergences between price and RSI often alert traders to weakening trends. RSI readings near 70 or 30 can complement Stochastic zones.
VWAP (for intraday)
The Volume-Weighted Average Price helps intraday traders assess where institutional flow might concentrate. Price above VWAP often shows bullish bias during New York hours.
Market Structure Tools
Higher highs/lows, trendlines, and supply/demand zones remain foundational. Indicators work best when anchored to structure, not used instead of it.
Using Indicators in Trending vs Ranging Conditions
Gold behaves differently depending on market environment.
Trending Markets
• Stochastic pullbacks can offer cleaner entries.
• ATR tends to expand, signalling wider stops.
• FVGs appear frequently during strong impulses and can help find continuation zones.
Ranging Markets
• Stochastic oscillations between 20 and 80 offer more signals, but also more false positives.
• ATR usually contracts, meaning shorter targets.
• FVGs exist but may not matter as much unless linked to higher timeframe levels.
Traders should define the environment before relying on any indicator. Misreading conditions is a common reason strategies underperform.
Avoiding Common Mistakes When Using Indicators on Gold
- Using indicators as trade triggers without context.
- Signals mean nothing without structure, trend and market conditions.
- Ignoring fundamentals around major news.
- Even perfect Stochastic or FVG setups can fail when NFP or CPI is minutes away.
- Overfitting settings.
- Changing parameters too often can destroy consistency. Default settings generally work well on gold due to its high liquidity.
- Using identical indicators.
- Combining RSI, Stochastic and CCI can overload the chart with momentum tools that say similar things.
- Stops that do not account for ATR.
- Gold’s volatility punishes stops that are too tight.
Building Your Own Indicator-Based Gold Trading Plan
A personal trading plan should specify which indicators you use, on which timeframes, and how they influence your decisions. Consistency reduces emotional decision-making, connecting well with lessons from Psychology and Common Mistakes in Gold Trading.
A good plan answers:
• What identifies the trend (e.g., moving averages)?
• What identifies momentum shifts (e.g., Stochastic)?
• How is volatility measured (e.g., ATR)?
• What defines an entry zone (e.g., FVG or structure levels)?
• When will you avoid trading (e.g., high-impact news events)?
• How will you size trades and place stops?
By formalising these rules, indicator signals become part of a broader, structured system rather than isolated hints. This supports both discipline and clarity, especially during fast gold moves.
FAQs
How many indicators should I use on my gold chart?
Most traders use two to four well-chosen indicators. The emphasis is on diversity: one for momentum, one for volatility, and one for structure. Too many indicators can create conflicting signals and slow decision-making.
Is Stochastic reliable for gold’s fast moves?
Stochastic can be effective, but only when used with structure such as support/resistance or FVG levels. Gold often stays overbought or oversold for long periods, so Stochastic should confirm, not lead, your trades.
How do I use ATR for stop-loss placement on XAUUSD?
ATR helps account for volatility. Traders often place stops 1–2 ATR beyond a structure level. This reduces the likelihood of being stopped out by normal gold fluctuation. ATR also helps adjust position size.
Are FVG zones valid on lower timeframes?
Yes, gold frequently creates FVGs on M1–M30 charts, especially during sessions with strong liquidity. But the most meaningful ones align with higher timeframe trends or levels.
Which timeframe works best for indicators on gold?
Many traders analyse trend on H4/H1 and execute on M30/M15. Indicators tend to behave more consistently on higher timeframes, while lower timeframes offer precision for entries.
Do indicators replace fundamentals when trading gold?
No. Technical indicators help with timing, but fundamentals often drive major gold moves. Awareness of events like NFP, CPI or FOMC is essential for evaluating risk around setups.
Can I use these indicators for both day trading and swing trading?
Yes, but settings and expectations differ. Swing traders rely more on higher timeframe signals and wider stops, while day traders emphasise ATR shifts, short-term Stochastic cycles and intraday FVGs.
Are indicator signals enough to trade breakouts?
Not by themselves. Breakouts improve in quality when supported by momentum, volatility and structure. ATR expansion and moving average alignment often help confirm breakout strength.
Technical indicators can improve trade timing and help confirm market conditions, but they work best as part of a complete trading plan. The next step is learning how to protect your capital and manage position size effectively. Continue with: Risk Management for Trading Gold: Position Sizing and Volatility Control.
This is not trading advice and is provided for educational purposes only.

