Understanding the Limits of Traditional Charts
Many traders eventually discover that classic candlesticks do not always tell the full story. A candle shows the open, high, low and close, but nothing about how price moved within that range, nor whether buyers or sellers were more aggressive.
When markets accelerate, fake breakouts multiply or volatility increases, relying solely on traditional charts can leave traders feeling as though they are reacting too late. This is where order-flow analysis enters the picture. Tools such as footprint charts and cumulative delta allow traders to look inside each candle and observe the interaction between aggressive buyers and sellers. The goal is not to replace your current strategy, but to improve timing and decision-making with a deeper understanding of market pressure.
What Footprint Charts Reveal Beyond Candlesticks
The Logic Behind the Footprint View
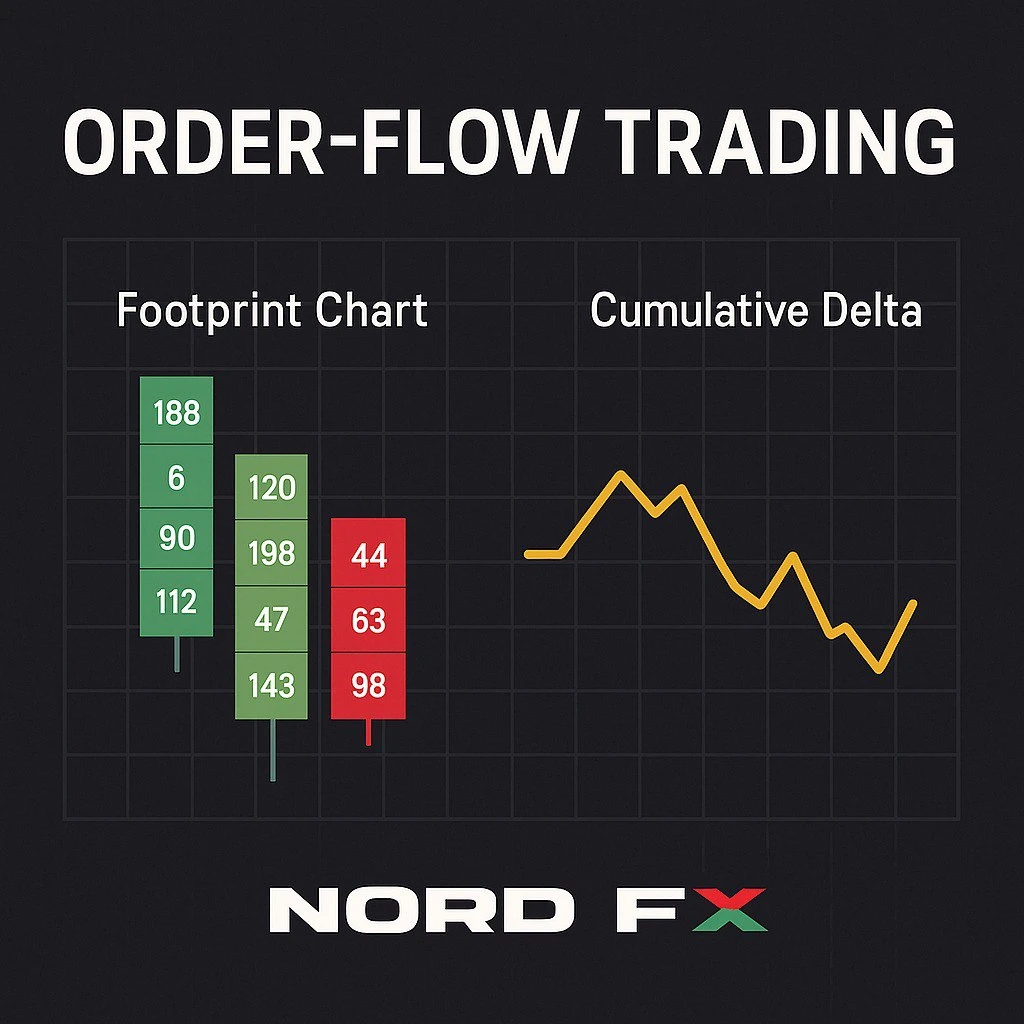
A footprint chart extends the classic candlestick by displaying trading activity at every price level within the bar. Instead of a single volume number, each price step contains two values: volume traded at the bid and volume traded at the ask. This structure helps traders see whether buyers were lifting the offer or sellers were hitting the bid, and where the strongest imbalances occurred.
Imagine EUR/USD rising from 1.0850 to 1.0880. On a traditional chart, this appears as a bullish candle. On a footprint chart, however, you might notice that most buying happened only in the middle of the range, while at the top sellers began to appear aggressively. That additional detail can completely change how you interpret the move.
Recognising Imbalances and Key Levels
Footprint charts often highlight the price level within each candle where the largest cluster of volume traded. This point of control can serve as an anchor for intraday analysis. Imbalances between bid and ask volume can expose areas where one side gained clear control. These imbalances often align with short-term support or resistance, complementing classic concepts such as support and resistance levels.
From Delta to Cumulative Delta: Tracking Buyer and Seller Pressure
What Is Delta?
Delta measures the net difference between aggressive buying and aggressive selling. When more trades occur at the ask than at the bid, delta is positive; when sellers dominate, delta turns negative. By observing delta bar by bar, traders can assess whether an apparent price move is being supported by conviction or if it lacks follow-through.
The Power of Cumulative Delta
Cumulative delta adds the delta of each bar to a running total. Rather than resetting every candle, it forms a continuous line that reveals whether buying or selling pressure is building over time.
A rising cumulative delta line indicates sustained aggressive buying, even if price temporarily stalls. A declining cumulative delta suggests that sellers continue to dominate, even if price experiences brief relief rallies.
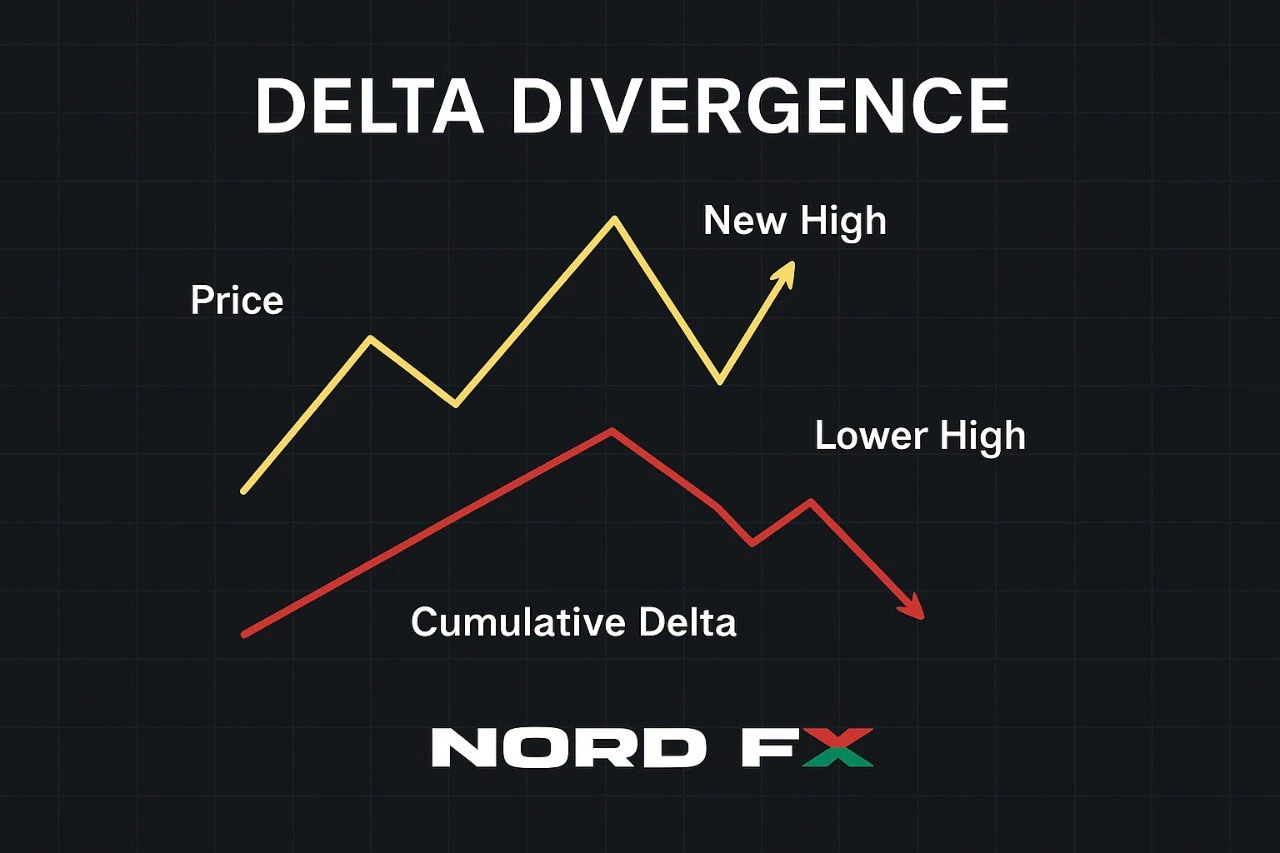
Divergence between price and cumulative delta often gives important context. When price makes a new high but cumulative delta remains weak, the move may reflect thin liquidity or short-term stop-hunting rather than genuine buying strength.
Using Order-Flow Tools in Decentralised Forex and CFD Markets
The Data Challenge in Spot Forex
The forex market has no central exchange. Liquidity is distributed across multiple banks and trading venues, which makes order-flow analysis more complex than in futures markets. Still, footprint charts and cumulative delta can be applied effectively through two main approaches:
Using futures data as a proxy for spot markets such as EUR/USD or XAU/USD; and
Using tick-based reconstructions on MT4/MT5 or specialist software to estimate bid/ask aggression.
Both approaches have limitations, but both also offer valuable insights into underlying market pressure.
Bridging Futures and Spot Markets
Despite structural differences, futures and spot markets are closely correlated. Large players often operate in both, allowing traders to use footprint and delta information from futures as a guide when trading spot forex or CFDs. This can help anticipate continuation or weakness around key levels or during macro events.
Practical Techniques for Forex and CFD Trading
Identifying True Breakouts
Breakouts are among the most common scenarios where order-flow tools shine. A footprint chart helps determine whether a breakout is supported by aggressive buying (or selling) or whether it is simply the result of thin liquidity. Heavy ask-side activity above resistance suggests genuine interest. Weak delta at the breakout point warns that the move may fail.
Reading Ranges Through Volume Behaviour
During periods of consolidation, footprint charts reveal whether buyers or sellers dominate each rotation. If sellers consistently appear at the same upper boundary, the range top is likely being defended. If buyers begin absorbing every dip, a breakout may be forming. These insights pair naturally with understanding trading volume, which often behaves differently inside a range than in a trending market.
Navigating Volatile News Releases
Major economic announcements can create rapid spikes that lack real follow-through. After the initial shock, footprint charts and cumulative delta help distinguish between a one-off reaction and sustained pressure. If delta builds in the same direction as the initial spike, continuation becomes more likely. If it fades or reverses, price may struggle to maintain momentum.
Integrating Cumulative Delta Into Multi-Timeframe Analysis
Starting With the Larger Picture
Before focusing on order-flow data, it is important to define the main structure of the market. Higher-timeframe zones, liquidity pockets and swings create the foundation. Cumulative delta then acts as a filter, helping you judge whether the market is genuinely accepting those levels or simply probing them.
Recognising Strong and Weak Pullbacks
A pullback supported by shallow delta often reflects weak counterpressure. In contrast, a pullback with sharp negative delta in an uptrend signals stronger seller presence. The same logic applies at market tops and bottoms.
Session Differences Matter
Forex behaviour changes throughout the trading day. Delta readings during high-liquidity periods—especially the London–New York overlap—tend to hold more weight than patterns formed during thin Asian hours. Aligning cumulative delta with session characteristics helps filter out noise.
Avoiding Common Mistakes With Order-Flow Tools
Overanalysing Micro-Patterns
Extremely small timeframes can create misleading impressions. Traders often fall into the trap of reading too much into very small imbalances. Larger timeframes offer more reliable context and improve decision-making.
Misinterpreting Divergence
Divergence between price and delta is informative but not predictive on its own. Markets can remain in a state of imbalance for extended periods. Combining divergence with price structure, sessions and clear levels creates a more reliable framework.
Expecting Perfect Precision
Order-flow tools in decentralised markets provide an approximation, not a complete institutional order book. They enhance understanding but cannot eliminate uncertainty. Proper risk management remains essential.
Bringing Footprint and Delta Into Your Trading Plan
The most effective way to use footprint charts and cumulative delta is to integrate them gradually. Traders who rely on classic tools such as market depth, support and resistance or trend structures can use footprint data to confirm or filter entries.
Using a demo account, saving examples and maintaining a visual journal helps accelerate the learning curve. Over time, order-flow analysis becomes a natural complement to your trading strategy, offering a deeper look at buyer and seller behaviour across forex, commodities, indices and crypto CFDs.

