Price breakouts and reversals are fundamental concepts in technical analysis, widely used across forex, cryptocurrency, and stock markets. Traders rely on these concepts to identify trading opportunities and manage risks effectively. A breakout signals the continuation of a trend, while a reversal indicates a change in market direction. Understanding how to recognize and trade these movements is crucial for anyone looking to make informed trading decisions.
What Is a Price Breakout?
A price breakout occurs when the price of an asset moves beyond a well-established resistance or support level with increased momentum. This movement signifies the potential start of a new trend, as traders and institutions react to changing supply and demand dynamics.
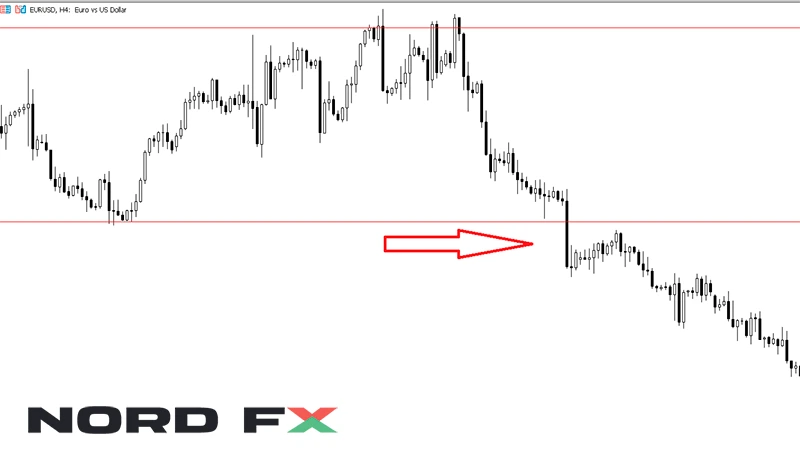
Breakouts can occur in either direction. An upside breakout happens when the price moves above a resistance level, suggesting a continuation of bullish momentum. A downside breakout occurs when the price falls below a support level, signaling a bearish trend. Breakouts are particularly significant when they are accompanied by high trading volume, as this confirms market interest in the new trend.
False breakouts are a common challenge for traders. A false breakout happens when the price moves beyond a key level but then quickly reverses, trapping traders who entered in the breakout direction. To avoid falling for false breakouts, traders often wait for confirmation, such as a sustained price movement beyond the breakout level or an increase in volume.
What Is a Price Reversal?
A price reversal is a shift in the prevailing trend. It occurs when the price of an asset stops moving in its previous direction and begins moving in the opposite direction. Unlike breakouts, which suggest trend continuation, reversals indicate that the existing trend is losing strength.
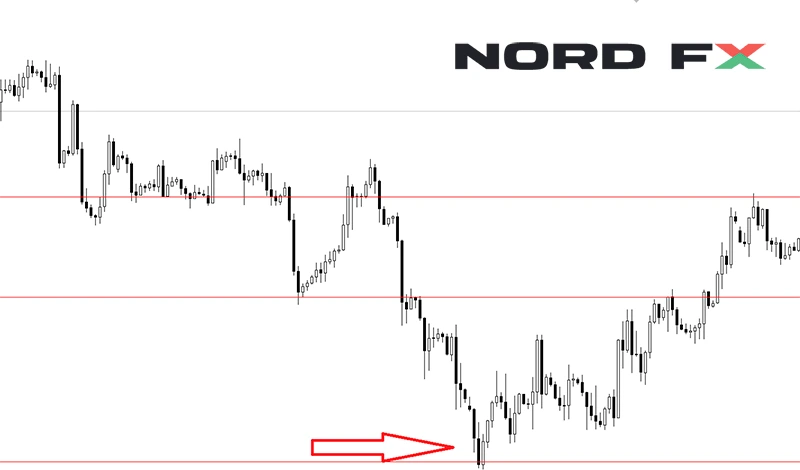
Reversals can be bullish or bearish. A bullish reversal happens when a downtrend slows down and transitions into an uptrend. A bearish reversal occurs when an uptrend loses momentum and the price starts declining. Reversals can happen over different time frames, from short-term market corrections to long-term trend changes.
Recognizing reversals early is essential for traders. Entering a trade too early or too late can result in unnecessary losses. Traders often look for key signals to confirm a reversal, such as weakening momentum, divergences in indicators, or chart patterns that indicate exhaustion of the current trend.
Key Indicators for Identifying Breakouts and Reversals
Technical indicators help traders identify potential breakouts and reversals. These indicators provide additional confirmation and help in setting entry and exit points.
- Moving Averages
- Moving averages help smooth price data to reveal trends over time. A crossover between short-term and long-term moving averages often signals a breakout or reversal. For example, when a short-term moving average crosses above a long-term moving average, it suggests bullish momentum.
- Relative Strength Index (RSI)
- The RSI measures the strength of a price movement. Values above 70 indicate overbought conditions, suggesting a potential reversal downward. Values below 30 indicate oversold conditions, signaling a possible upward reversal.
- Moving Average Convergence Divergence (MACD)
- The MACD is a momentum indicator that shows the relationship between two moving averages. A crossover of the MACD line above the signal line suggests a bullish breakout, while a crossover below indicates a bearish reversal.
- Bollinger Bands
- Bollinger Bands measure price volatility. When the bands contract, it suggests low volatility, often preceding a breakout. If the price moves beyond the bands, it may indicate a strong trend or an overbought/oversold condition that could lead to a reversal.
- Volume Analysis
- Volume is crucial in confirming breakouts and reversals. A breakout accompanied by high volume is more likely to be valid. A reversal with increasing volume signals strong conviction in the new trend direction.
Breakout Trading Strategies
Breakout trading involves capitalizing on price movements beyond key levels. Traders use different strategies to identify and trade breakouts effectively.
- Identifying Key Levels
- Traders analyze historical price data to identify major support and resistance levels. These levels act as psychological barriers where the price has previously struggled to break through.
- Waiting for Confirmation
- Instead of entering a trade immediately after a breakout, traders often wait for a sustained price move beyond the breakout level. Confirmation may come from increased volume, retesting of the breakout level, or other indicators supporting the move.
- Breakout Pullback Strategy
- A pullback occurs when the price returns to the breakout level before continuing in the breakout direction. Traders wait for this retest to confirm the breakout before entering the trade. This reduces the risk of getting caught in a false breakout.
- Setting Stop-Loss Orders
- Managing risk is essential when trading breakouts. Traders place stop-loss orders just inside the breakout level to minimize losses in case of a failed breakout.
- Profit Targets and Trade Management
- Traders set profit targets based on previous price action, Fibonacci extensions, or measured moves. Some traders trail their stop-losses to lock in profits as the trade progresses.
Reversal Trading Strategies
Trading reversals requires patience and confirmation to avoid false signals. These strategies help traders identify and trade market reversals effectively.
- Divergence Strategy
- When price movement diverges from indicators like RSI or MACD, it signals a weakening trend. For example, if the price is making new highs, but the RSI is making lower highs, it suggests bullish momentum is fading, increasing the likelihood of a bearish reversal.
- Candlestick Patterns
- Reversal candlestick patterns provide visual confirmation of potential trend changes. Some of the most reliable reversal patterns include the hammer, engulfing pattern, and doji.
- Break of Trendline Support or Resistance
- A trendline connects multiple price points in a trend. When the price breaks a long-standing trendline, it signals a potential reversal. Traders wait for confirmation before entering a trade.
- Volume Confirmation
- A reversal with increasing volume adds credibility to the signal. A declining trend with rising volume suggests selling pressure is increasing, supporting a potential bearish reversal.
- Risk Management in Reversal Trading
- Since reversals can be unpredictable, traders set stop-loss orders above or below recent highs/lows to protect against losses. Position sizing is also crucial to avoid overexposure.
Real-World Applications
Traders apply breakout and reversal strategies across different markets.
In the forex market, a breakout in the EUR/USD pair above a long-term resistance level may signal a bullish trend continuation. A bearish reversal might occur if the price fails to sustain above that level and falls back.
In the cryptocurrency market, Bitcoin’s price fluctuations often lead to breakouts around psychological levels. If Bitcoin breaks above a resistance level with strong volume, traders anticipate further upward momentum. However, a reversal might happen if buying pressure weakens.
In the stock market, breakout traders look for stocks forming consolidation patterns before a strong price move. A stock trading in a range for weeks may experience a breakout after an earnings report or major announcement.
Conclusion
Breakouts and reversals are essential concepts in technical analysis, helping traders navigate market trends and make informed decisions. Using key indicators, volume analysis, and strategic trade management, traders can effectively capitalize on market movements while minimizing risk. Understanding these patterns and applying advanced trading strategies can improve trading performance in forex, cryptocurrency, and stock markets.
Disclaimer: These materials are not an investment recommendation or a guide for working on financial markets and are for informational purposes only. Trading on financial markets is risky and can lead to a complete loss of deposited funds.
Go Back Go Back
